7 Empirical validation
There have been few attempts to validate empirically the estimates of density from SECR: critical evaluations have relied overwhelmingly on simulation. Empirical validation requires a reliable estimate of the true density, usually from counting the individuals with activity centres in a known area. Enumeration may be by intensive observation of conspicuous diurnal species or by sampling until no new individual is found. Delineation of the relevant area is straightforward when the habitat is a natural island or fenced area. We exclude studies such as Twining et al. (2022) that evaluated SECR by comparing density estimates among methods, as these are vulnerable to shared biases.
We describe four attempts at empirical validation of density estimates, each with a different approach. The evidence from empirical validation studies tends to be weak, owing to the wide confidence intervals and methodological constraints. None is entirely convincing, as we shall see.
A fifth study suggests that detection parameters may vary between detector layouts. This raises a caveat for simulation (Section 8.4).
7.1 Brushtail possums in New Zealand
Efford et al. (2005) live-trapped brushtail possums (Trichosurus vulpecula) on a coastal peninsula and compared the results to an attempted total removal by leg-hold trapping and acute poisoning. SECR estimates of density from five hollow grids (36 traps around the perimeter of a square) were consistent with the removal estimate.
Although broadly reassuring, the brushtail possum study had weaknesses. The live-trapping data were compromised by tag loss (documented in secr), the landward boundary of the removal area was somewhat arbitrary, and sampling may have been inadequate to represent density variation across the peninsula (see also Rodents in New Mexico).
7.2 Red squirrels in the Yukon
Van Katwyk (2014) analysed data from a multi-year behavioural study of red squirrels (Tamiasciurus hudsonicus) in the Yukon. Squirrels were marked and followed across six study areas, each about 36-ha in area. Intensive trapping at defended food middens maintained nearly 100% marking coverage. Capture–recapture data came from 50 cage traps operated periodically in the centre of each study area.
Calculation of ‘true’ density focussed on the area within the perimeter of the trapping grid. Behavioural observations of all squirrels whose territories potentially overlapped the grid (i.e. within one territory width) were scored for time spent inside the grid. The sum of these proportions is the number of ‘animal equivalents’ (Boutin, 1984) that gives the population density when divided by the grid area.
SECR density estimates averaged only 5% less than the ‘true’ density calculated by this method, and the estimates showed a strong correlation between sessions with the varying ‘true’ density. It is hard to fault this validation. The ‘true’ density was limited to the interior of each grid, whereas each SECR estimate includes data from a somewhat wider area and sample sizes were modest.
7.3 Rodents in New Mexico
One major evaluation has questioned the reliability of SECR. Gerber & Parmenter (2015) re-analysed live-trapping data for rodents of several taxa confined to pens in New Mexico (Parmenter et al., 2003). Traps were arranged in either a central square grid or a star-shaped pattern, a ‘trapping web’. The main study was followed by intensive trapping across the full extent of each pen to enumerate each taxon.
SECR provided instances of both over- and under-estimation, and its performance was “sometimes underwhelming”. The authors focussed on heterogeneity of detection and asymmetry of home ranges as possible explanations, although direct evidence of these effects was lacking. Asymmetry is not a significant source of bias in itself (Efford (2019)). Heterogeneity must be large to cause significant bias, and the bias is negative (e.g., Efford & Mowat (2014)) see also 6.
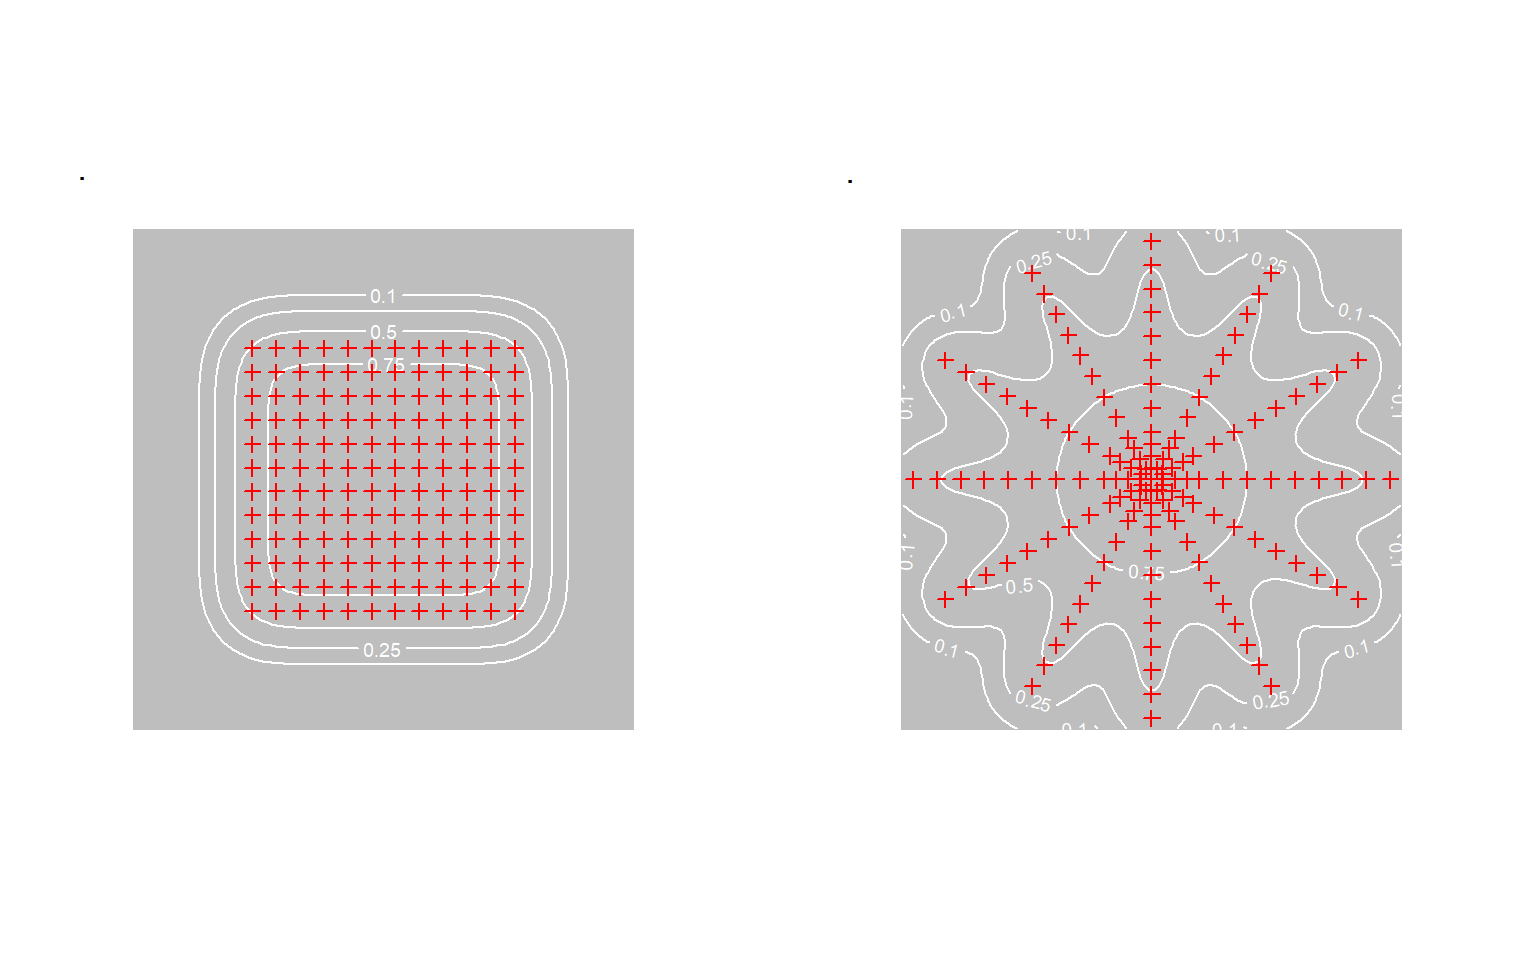
We suggest an alternative explanation. The main trap layouts did not sample the full extent of each pen, and the probability of detecting an individual in the periphery was quite low for species with small home ranges such as Perognathus flavus (Fig. 7.1). Perfect correspondence with pen-wide exhaustive trapping is not to be expected if the density in the under-sampled peripheral zone differs from the central zone. This applies whether the difference is random or systematic. The peripheral zone (p_\cdot(\mathbf x) < 0.25) was a larger fraction of the pen for the grid (\approx 54\%) than for the web (\approx 28\%), which could explain why the grid estimates of P. flavus density were particularly poor (Gerber & Parmenter, 2015, Figures 2a, 3a).
The final exhaustive trapping might be used to test the hypothesis of spatial heterogeneity, but these data are not available. Some evidence of within-pen density variation may be gleaned from density models fitted to the capture–recapture data: in 50% of the populations a density model that included distance-to-wall as a covariate provided better fit than a null model in 50% of cases (likelihood ratio test P < 0.05; unpubl. results).
7.4 Chimpanzees in Ivory Coast
Després‐Einspenner et al. (2017) applied SECR to automatic camera records of chimpanzees Pan troglodytes in a single group territory. Group size (27 excluding unweaned young) was known from intensive observations. The authors reported a good match between the estimated and known populations. However, \sigma could not be estimated because individuals moved throughout the territory and cameras were not placed outside it (see also comments on array size under Study design). This required them to treat the extent of the population as known (confined within the independently determined territory boundary). The resulting analysis is in essence non-spatial, and does not validate SECR.
7.5 Red-backed salamanders in Massachusetts
Fleming et al. (2021) examined the effect of varying the configuration of cover boards used to survey red-backed salamanders (Plethodon cinereus). Cover boards are artificial refuges placed on the ground. Data on salamanders found under cover boards are analysed as if cover boards were multi-catch traps. The authors’ concern was that SECR estimates of salamander density might depend on the layout and interfere with comparisons and aggregation of data across studies. Estimates of detection parameters (half-normal intercept g_0 and spatial scale \sigma) were sensitive to the extent and spacing of cover board arrays, whereas density estimates were mostly robust. Salamanders appeared more mobile (larger \hat \sigma) when cover boards were further apart. Fleming et al. (2021) suggested salamanders might move directly to the next cover board, presumably within some distance limit.
7.6 Summary
None of these field studies fully validates SECR methods, but there is at least no strong counter evidence. We encourage field researchers to test SECR further. Where discrepancies are found it is important to investigate the cause. The assumption of independence among detectors underpins the compounding of single-detector distance-detection functions to predict array-level detection probability. Evidence supporting this assumption might relieve the need for elaborate models such as Stevenson et al. (2021).